Automating Reporting with RMarkdown
Background and Problem Overview
RMarkdown is a powerful tool widely used for creating dynamic, professional reports that blend text, code, and visualizations. It’s efficient and versatile, offering outputs in formats like PDF, HTML, Word, and even interactive files, making it a go-to solution for data reporting. But beyond its basic capabilities, RMarkdown offers a hidden advantage: the potential to automate report generation. By doing this, users can avoid repetitive manual updates, which not only saves time but also reduces the chance of errors, especially when content remains largely consistent with only specific details needing adjustment.
Recently, I experienced firsthand how automating RMarkdown reporting can enhance both speed and accuracy in my workflows. This blog will serve as a step-by-step guide, showing how you can leverage RMarkdown’s automation features to streamline your own projects with minimal parameter adjustments.
Problem Scenario
In a recent project, I needed to generate multiple reports for PCA analysis across two comparison groups. For each group, I had to update several pieces of narrative text and adjust file paths for specific figures and tables. This repetitive, manual process quickly became time-consuming and error-prone. With RMarkdown’s programming capabilities, I was able to automate these updates, saving at least 30% of my time. Not only did this streamline the current project, but it also set up a reusable template for future reporting needs.
Prerequisites
Before diving into automating RMarkdown reports, it’s important to have a foundational understanding of a few key concepts and tools. These prerequisites will help ensure a smooth experience as you follow along with the guide.
- Parameters in the YAML Header: In RMarkdown, the YAML header at the top of your file allows you to set global parameters that can be accessed throughout the document. These parameters let you customize elements such as titles, dates, and specific variables needed for your analysis. Knowing how to define and edit parameters in the YAML header is essential for making your reports dynamic and flexible.
- Creating Variables from Parameter Values: Once parameters are set in the YAML header, they need to be referenced within the document. This involves creating variables in R that directly pull from these parameter values. By doing so, you can easily update specific content across the report by simply changing the parameter values, without having to adjust individual sections manually.
- Embedding Parameters Using knit: RMarkdown’s knit function allows you to insert parameters within text, code chunks, or inline calculations. This embedding feature is crucial for dynamically adjusting content within the report, ensuring that titles, captions, and sections update seamlessly with each rendering of the file.
- The rmarkdown::render() Function: This function is central to programmatically creating reports. It lets you specify an RMarkdown file along with any custom parameters you want to update for each run. By using rmarkdown::render(), you can generate multiple customized reports in one go by changing parameters in a loop.
- Iterating with for Loops: Automation often requires generating multiple outputs for different variables or scenarios. A basic understanding of for loops in R is helpful here, as it allows you to iterate over different parameter sets, such as comparison groups in an analysis. This approach makes it easy to replicate report structures with tailored content for each scenario.
- Running Base Command Lines in R: Certain aspects of automating RMarkdown reports may involve running command-line operations directly from R. This skill enables you to manage file paths, automate data downloads, or perform batch processing, enhancing the report’s flexibility and reducing manual workload.
Familiarity with these components will help you set up an efficient, automated RMarkdown reporting process that can be reused and adapted to meet future reporting needs.
If you’re new to RMarkdown or R, I recommend reviewing the basics in the official guide, R Markdown: The Definitive Guide, to ensure you’re comfortable with these fundamentals before proceeding.
Data and Codes
To follow along with this tutorial and reproduce the automated reporting process, you can clone the repository containing all necessary files to your local machine. The repository includes all essential scripts and files required to generate a fully automated RMarkdown report.
- RMarkdown File (
AutomateRMarkdown/code/pca-module.Rmd): **This core file contains the report template, including text, code chunks, and the YAML header with customizable parameters. The .Rmd file is structured to dynamically integrate analysis results, figures, and tables based on parameter values, so modifying the parameter inputs will automatically adjust the contents of the report. - R Script File (
AutomateRMarkdown/code/combine-rmarkdown-files.R): The .R file complements the RMarkdown report by containing the main script to render the report programmatically. It includes necessary functions, such as rmarkdown::render(), to automate the report generation, manage parameter values, and run any looping structures for batch reporting. - Figures and Tables (
AutomateRMarkdown/data/): Sample figures and tables are included in the repository to simulate typical analysis outputs, such as plots and summary tables. These files are referenced within the RMarkdown file to illustrate how visuals and data outputs can be dynamically incorporated. You can replace these with your own figures and tables to customize the report further.
By downloading and running these files locally, you’ll be able to experiment with the process firsthand and see how each component interacts in automating RMarkdown reports.
Step-by-Step Guide
This guide provides a structured approach to automating an RMarkdown report. We’ll go through the setup and use key parameters in .Rmd and .R files to streamline the reporting process.
In this example, we have two PCA comparison groups, “WT-NC vs WT-HFD” and “KO-NC vs KO-HFD.” The report structure is adaptable for other groups by adjusting parameters as needed.
Step 1: Organizing and Naming Files
Start by organizing our data files. Create two folders named Download_WT-NC_WT-HFD and Download_KO-NC_KO-HFD. Each folder will hold three essential files for the PCA report:
• pca_scored2d_0_dpi72.png (PCA score plot image)
• metabolite-names.csv (metabolite names table)
• pca_loadings.csv (PCA loadings data)
These folders should follow a consistent naming pattern and contain identically named files, which will help in dynamically generating the report.
Step 2: Creating the Initial .Rmd File and YAML Header
In RStudio, create an RMarkdown file named pca-module.Rmd. Set up the YAML header with the following fields to define metadata for the report:
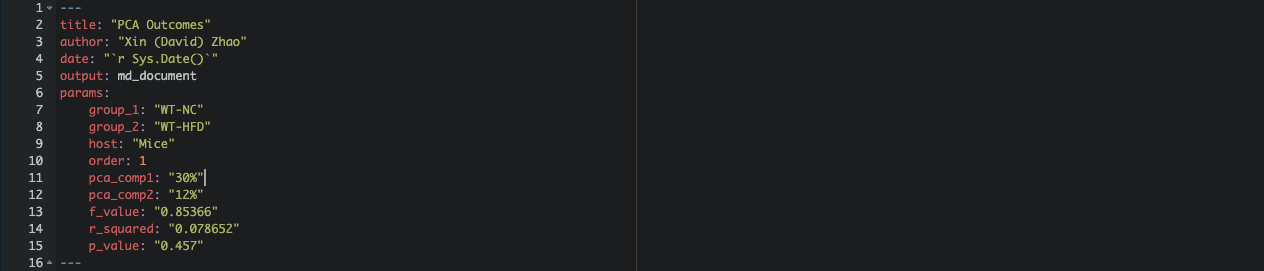
- title, author, and date define basic document metadata.
- output is set to md_document to output in markdown format.
- params initializes customizable parameters (group_1, group_2, order) to control specific sections in the report.
Step 3: Setting Up Parameters
In the YAML header, the params section allows parameters to be adjusted dynamically through rmarkdown::render() outside the RMarkdown document.
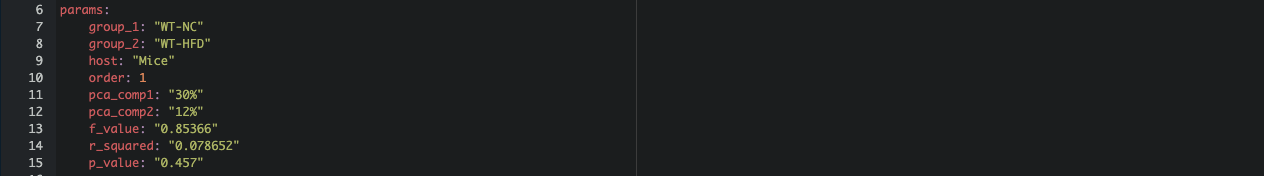
Each parameter (eg. group_1, group_2, order) is initialized to represent the first group and can be modified later in the .R script for other groups.
Step 4: Defining Global Variables
Within the RMarkdown document, define global variables to capture parameter values and paths for figures and tables:
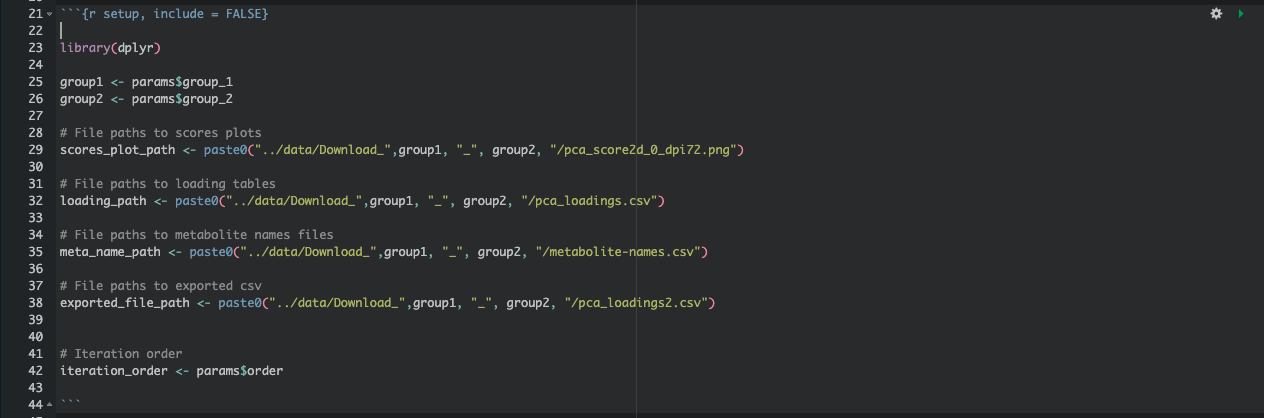
These variables allow us to set paths and references that will update automatically with each parameter iteration.
Step 5: Editing Subtitles with Code
To make subtitles change dynamically for each group, use a for loop and if-else statements:
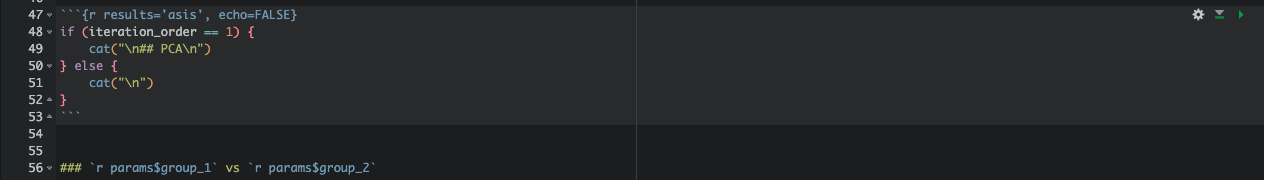
This will display a specific subtitle for the first group and adjust accordingly for subsequent groups. Inline R code can also be used to insert parameter-based subtitles at different levels in the report.
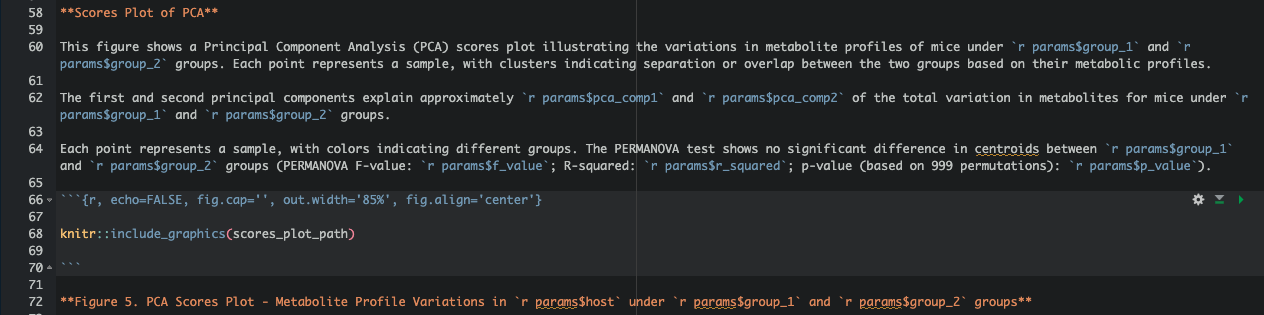
Step 6: Embedding Variables in Figures, Tables, and Narrative Text
In the body of the report, combine static text with inline R code to make dynamic sections for figures, tables, and narrative text.
Step 7: Writing a Loop to Automate Rendering
In a new .R script, create a function to loop through each group, rendering the .Rmd file for each set of parameters.
- Create a Data Frame: Define groups with corresponding values in a data frame.
groups_collection2 <- data.frame(group_1 = c("WT-NC", "KO-NC"),
								 group_2 = c("WT-HFD", "KO-HFD"),
								 orders = c(1, 2))
- Loop through Groups: Use a for loop with rmarkdown::render() to render the .Rmd file for each group.
for (n in 1:nrow(groups_collection2)) {
	group_1 = groups_collection2$group_1[n]
	group_2 = groups_collection2$group_2[n]
	order = groups_collection2$orders[n]

	rmarkdown::render("pca-module.Rmd",
		output_file = paste0("pca_", group_1, "_", group_2, ".md"),
		params = list(group_1 = group_1,
		              group_2 = group_2,
					  host = "Mice",
					  order = order))
									}
Executing this loop generates markdown reports for each comparison group, saved with unique filenames.
Step 8: Merging Markdown Files in Command Line
Finally, combine the individual markdown files into one file with an R command:
system("cat pca_WT-NC_WT-HFD.md > combined_pca.md && echo >> combined_pca.md && cat pca_KO-NC_KO-HFD.md >> combined_pca.md")
This will create a single file, combined_pca.md, containing the complete report with results for both groups.
Following these steps, you can streamline report creation for multiple groups, making RMarkdown a powerful tool for efficient, reproducible analysis.
Takeaway
RMarkdown is a powerful tool for creating high-quality, reproducible reports, and by integrating programming solutions, it becomes even more versatile. By following this guide, you’ve gained insight into setting up dynamic and reusable report templates, which can save time and improve accuracy.
Now it’s your turn! Clone the GitHub repo and try running the example code yourself. Once you get familiar with it, experiment by customizing sections to fit your unique data or reporting needs. This hands-on approach will not only deepen your understanding but also help you master dynamic reporting for any project!