Top R Packages for GO Enrichment Analysis: topGO vs globaltest Explained
1. Introduction
Gene Ontology (GO) enrichment analysis is a cornerstone of gene expression studies. It helps researchers identify biological processes, molecular functions, and cellular components that are overrepresented in a set of genes, offering insights into the underlying biology. Several statistical methods can be used for GO enrichment analysis, including Fisher’s exact test, the Kolmogorov-Smirnov test, and the global test.
This article aims to simplify the process of choosing an appropriate R package for GO enrichment analysis by introducing two popular Bioconductor packages: topGO and globaltest. While both packages are widely used, their distinct statistical methods and outputs can make it challenging to choose the right tool for your study. This guide compares these packages, highlights their differences, and provides practical examples to help researchers, especially those with busy lab schedules, efficiently integrate GO analysis into their workflows.
2. Overview of Bioconductor Packages
topGO
topGO is a versatile R package for GO enrichment analysis, well-suited for identifying specific GO terms that are enriched among differentially expressed genes. It primarily employs statistical methods like Fisher’s exact test and the Kolmogorov-Smirnov test, making it a reliable choice for detecting overrepresentation in gene lists. With its robust functionality and detailed documentation, topGO is a go-to tool for exploring gene-level associations in various biological datasets.
globaltest
globaltest takes a different approach by assessing whether specific GO terms are associated with clinical outcomes or other continuous variables. It uses the global test methodology, which evaluates associations at a more holistic level compared to gene-specific tests. This makes it particularly valuable for studies where the research question involves linking GO terms to phenotypic data, such as disease progression or treatment response.
Key Differences in Statistical Approaches
Both packages are highly ranked in the Bioconductor repository due to their active maintenance and comprehensive documentation. However, their underlying statistical methods set them apart:
• topGO: Uses Fisher’s exact test or the Kolmogorov-Smirnov test to test the null hypothesis that no specific GO terms are enriched in a set of genes.
• globaltest: Employs the global test to evaluate the null hypothesis that no association exists between a set of genes and a clinical outcome or phenotype.
Use Case Comparison
• topGO is ideal for researchers seeking to uncover enriched biological processes in differentially expressed genes.
• globaltest is better suited for studies focused on linking GO terms to clinical or phenotypic outcomes, such as identifying functional pathways associated with disease progression.
By understanding these distinctions, researchers can choose the package that best aligns with their study objectives.
3. Setting Environment
Setting up includes ensuring the required packages are installed and loaded.
# Install globaltest Biocondcutor package
BiocManager::install(c("globaltest", "topGO", "golubEsets", "vsn", "hu6800.db", "GO.db", "AnnotationDbi", "annotate", "topGO", "ALL", "Biobase", "limma"))

# Load the globaltest package
library(topGO)
library(globaltest)
library(golubEsets)
library(vsn)
library(hu6800.db)
library(AnnotationDbi)
library(methods)
library(annotate)
library(limma)
library(dplyr)
4. Data Prepration
Data preprocessing and normalization.
# Load the Golub training data set consisting of 7129 genes and 38 samples (27 ALL and 11 AML)
data(Golub_Train, package = "golubEsets")

## Normalize the data using the VSN package
Golub_Train_VSN <- vsn::vsn2(exprs(Golub_Train))
Gene expression data before the normalization process:
A matrix: 5 x 10 of type int
| 1 | 2 | 3 | 4 | 5 | 6 | 7 | 8 | 9 | 10 | |
|---|---|---|---|---|---|---|---|---|---|---|
| AFFX-BioB-5_at | -214 | -139 | -76 | -135 | -106 | -138 | -72 | -413 | 5 | -88 |
| AFFX-BioB-M_at | -153 | -73 | -49 | -114 | -125 | -85 | -144 | -260 | -127 | -105 |
| AFFX-BioB-3_at | -58 | -1 | -307 | 265 | -76 | 215 | 238 | 7 | 106 | 42 |
| AFFX-BioC-5_at | 88 | 283 | 309 | 12 | 168 | 71 | 55 | -2 | 268 | 219 |
| AFFX-BioC-3_at | -295 | -264 | -376 | -419 | -230 | -272 | -399 | -541 | -210 | -178 |
Gene expression data after the normalization process:
A matrix: 5 x 10 of type dbl
| 1 | 2 | 3 | 4 | 5 | 6 | 7 | 8 | 9 | 10 | |
|---|---|---|---|---|---|---|---|---|---|---|
| AFFX-BioB-5_at | 5.053873 | 5.396673 | 5.972362 | 5.549766 | 5.337167 | 5.411235 | 5.968888 | 4.616873 | 6.396420 | 5.615805 |
| AFFX-BioB-M_at | 5.364311 | 5.838160 | 6.128136 | 5.678733 | 5.212093 | 5.797844 | 5.508008 | 5.178958 | 5.605328 | 5.480476 |
| AFFX-BioB-3_at | 5.948439 | 6.391596 | 4.906233 | 8.079299 | 5.550368 | 8.071159 | 7.967052 | 6.646939 | 7.033943 | 6.825375 |
| AFFX-BioC-5_at | 6.988237 | 8.224862 | 8.003817 | 6.558152 | 7.593938 | 7.118814 | 6.884934 | 6.591159 | 7.872088 | 8.162249 |
| AFFX-BioC-3_at | 4.707586 | 4.747971 | 4.672928 | 4.322134 | 4.638834 | 4.665432 | 4.390771 | 4.257310 | 5.197148 | 4.978863 |
5. GO Enrichment Analysis with topGO
GO enrichment with topGO
# Create a topGOdata object
sampleGOdata <- new("topGOdata", description = "Simple session", ontology = "BP", allGenes = pvalues, geneSel = topDiffGenes, nodeSize = 10, annot = annFUN.db, affyLib = affyLib)

# Run GO enrichment analysis with Fisher's exact test
resultFisher <- runTest(sampleGOdata, algorithm = "classic", statistic = "fisher")
Display summary of results:
# Display the results
resultFisher
Description: Simple session
Ontology: BP
'classic' algorithm with the 'fisher' test
5431 GO terms scored: 302 terms with p < 0.01
Annotation data:
    Annotated genes: 6234
    Significant genes: 1512
    Min. no. of genes annotated to a GO: 10
    Nontrivial nodes: 5341
Show the top 10 enriched GO terms:
| GO.ID <chr> | Term <chr> | Annotated <int> | Significant <int> | Expected <dbl> | Rank in classicFisher <int> | classicFisher <chr> | classicKS <chr> | elimKS <chr> | |
|---|---|---|---|---|---|---|---|---|---|
| 1 | GO:0010042 | response to manganese ion | 18 | 14 | 4.37 | 10 | 2.6e-06 | 2.1e-06 | 2.1e-06 |
| 2 | GO:0000002 | mitochondrial genome maintenance | 13 | 8 | 3.15 | 199 | 0.00458 | 0.00015 | 0.00015 |
| 3 | GO:0044539 | long-chain fatty acid import into cell | 11 | 8 | 2.67 | 88 | 0.00095 | 0.00017 | 0.00017 |
| 4 | GO:0070198 | protein localization to chromosome, telo… | 20 | 13 | 4.85 | 43 | 0.00013 | 0.00018 | 0.00018 |
| 5 | GO:0071897 | DNA biosynthetic process | 109 | 41 | 26.44 | 101 | 0.00118 | 1.1e-05 | 0.00029 |
| 6 | GO:0045429 | positive regulation of nitric oxide bios… | 32 | 18 | 7.76 | 42 | 0.00010 | 0.00033 | 0.00033 |
| 7 | GO:0016570 | histone modification | 44 | 16 | 10.67 | 694 | 0.04846 | 0.00053 | 0.00053 |
| 8 | GO:0098869 | cellular oxidant detoxification | 70 | 28 | 16.98 | 142 | 0.00243 | 0.00056 | 0.00056 |
| 9 | GO:0045820 | negative regulation of glycolytic proces… | 11 | 9 | 2.67 | 39 | 9.6e-05 | 0.00056 | 0.00056 |
| 10 | GO:1903241 | U2-type prespliceosome assembly | 15 | 9 | 3.64 | 168 | 0.00332 | 0.00057 | 0.00057 |
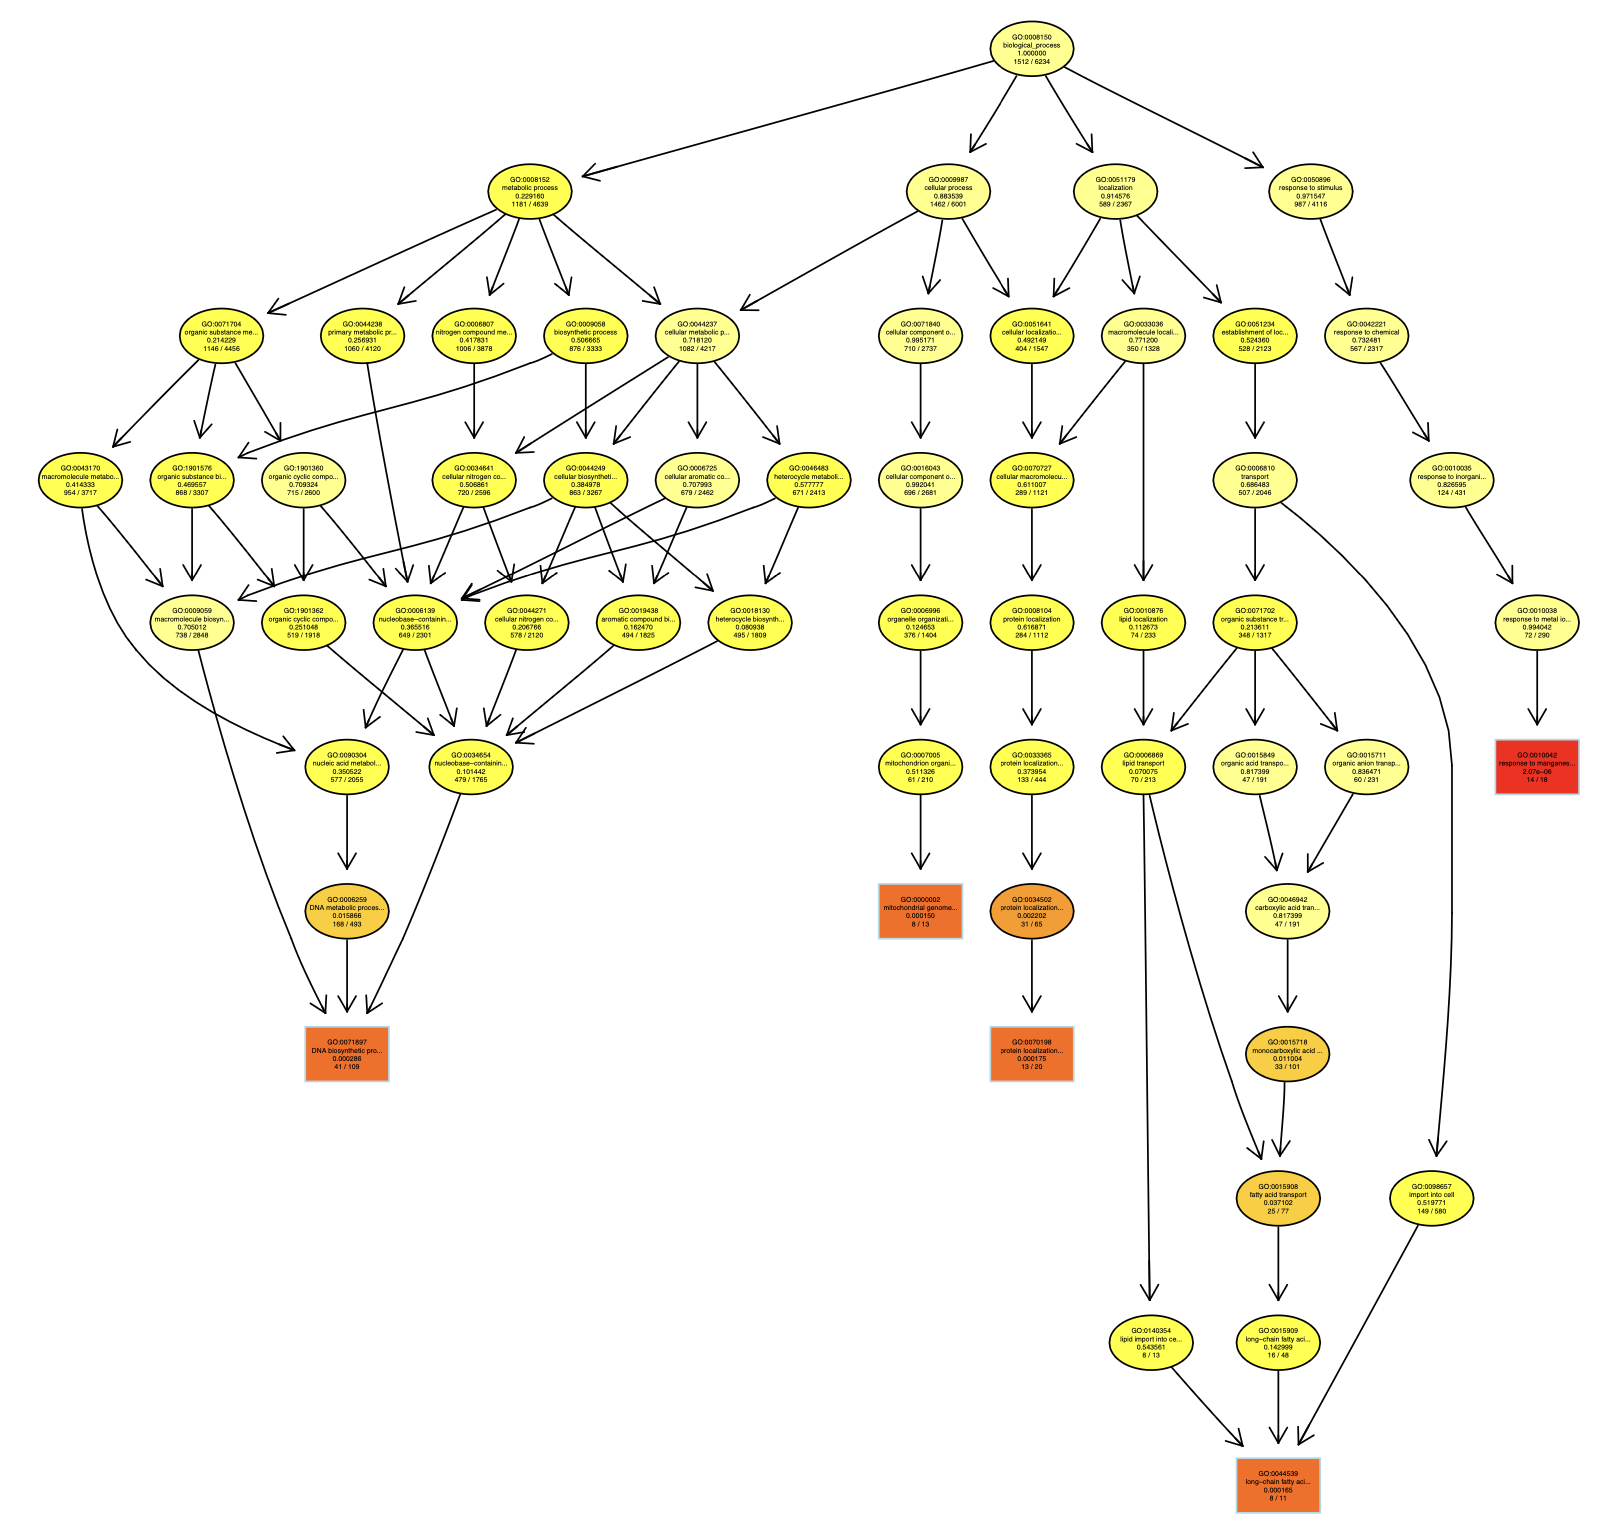
The GO topology graph for the top 5 enriched GO terms is shown below:
6. Analysis with globaltest
global_test_result <- globaltest::gt(response = ALL.AML, alternative = Golub_Train)

res <- globaltest::gtGO(ALL.AML, Golub_Train,ontology = "BP", annotation = "hu6800.db", multtest = "BH")
| GO <chr> | alias <chr> | BH <dbl> | |
|---|---|---|---|
| 1 | GO:0006979 | response to oxidative stress | 5.937219e-09 |
| 2 | GO:0062197 | cellular response to chemical stress | 5.937219e-09 |
| 3 | GO:0034599 | cellular response to oxidative stress | 5.937219e-09 |
| 4 | GO:0034614 | cellular response to reactive oxygen species | 1.479059e-08 |
| 5 | GO:0009628 | response to abiotic stimulus | 2.469754e-08 |
| 6 | GO:0000302 | response to reactive oxygen species | 2.680335e-08 |
| 7 | GO:0019932 | second-messenger-mediated signaling | 1.030937e-07 |
| 8 | GO:0019722 | calcium-mediated signaling | 1.080573e-07 |
| 9 | GO:0050921 | positive regulation of chemotaxis | 1.080573e-07 |
| 10 | GO:0003013 | circulatory system process | 1.342398e-07 |
5. Comparing Results
The results of GO enrichment analysis using topGO and globaltest provide distinct yet informative insights into the biological processes underlying the data.
Key Results and Differences:
• Significant GO Terms:
• topGO identified 302 significant GO terms using the Fisher’s exact test, with a focus on Biological Process (BP) ontology, while globaltest highlighted 10 highly significant GO terms, such as “response to oxidative stress” (GO:0006979) and “cellular response to reactive oxygen species” (GO:0034614).
• Methodological Nuances:
• topGO excels in leveraging the GO hierarchy, particularly with algorithms like “elim” to minimize redundancy. This approach is effective for capturing nuanced biological pathways.
• globaltest uses a multivariate approach that evaluates the overall association between gene sets and outcomes, making it particularly sensitive to systemic biological patterns.
Type of Questions Addressed:
• topGO is better suited for researchers aiming to understand specific enriched processes while accounting for the GO graph topology.
• globaltest is ideal for broader hypotheses, such as assessing the overall contribution of a gene set to a phenotype.
6. Discussion
The results from topGO and globaltest are largely complementary rather than competitive. Each package offers a unique lens through which to interpret the data:
• Complementary Insights:
• topGO provides granular details about localized processes within the GO hierarchy.
• globaltest identifies overarching biological associations, highlighting system-wide trends.
• Scenarios for Combining Insights:
• Combining topGO’s hierarchical insights with globaltest’s systemic view can help uncover both specific mechanisms and broader biological themes, particularly for complex datasets.
• For example, a researcher could first use topGO to pinpoint key pathways and then employ globaltest to evaluate their aggregate impact.
• Limitations and Considerations:
• topGO assumes independence between GO terms, which may oversimplify relationships in some contexts.
• globaltest may lose specificity in its focus on global patterns, potentially overlooking individual pathway nuances.
• Computational efficiency may also differ: topGO’s hierarchical algorithms may demand more preprocessing, while globaltest benefits from a simpler multivariate setup.
7. Conclusion
This comparative analysis demonstrates that both topGO and globaltest offer valuable but distinct approaches to GO enrichment analysis:
Practical Takeaways:
-
topGO is preferred for detailed pathway analysis, especially for datasets with hierarchical biological information.
-
globaltest excels in scenarios requiring a holistic assessment of gene set relevance to phenotypes.
Encouragement for Beginners:
New researchers are encouraged to explore both packages to deepen their understanding of GO enrichment methods. Experimenting with these tools fosters a comprehensive grasp of the biological and statistical nuances critical for robust bioinformatics analysis.