Power Analysis as a Workflow for Microbiome Data
Background & Motivation: Why reproducible power analysis matters
In microbiome research, whether in human cohorts or animal trials, determining the appropriate sample size is essential. Studies that are too small lack the statistical power to detect meaningful biological effects, while studies that are unnecessarily large risk wasting resources and raising ethical concerns.
Despite this, power analysis is frequently misapplied in microbiome studies.
As both a data analyst and an academic journal reviewer, I often encounter microbiome studies that are underpowered. Importantly, these studies are rarely weakened because authors lack statistical knowledge. More often, they fall short because the assumptions underlying the power analysis are unclear, inconsistently applied, or difficult to reproduce. Common reviewer concerns include effect sizes chosen without justification, limited exploration of alternative assumptions, and power calculations that cannot be revisited when study design choices are questioned.
These challenges are amplified by the high variability and sparsity characteristic of microbiome data, whether derived from marker-gene or shotgun sequencing. For example, a trial designed to detect differences in gut microbial diversity between treatment and control groups may fail, not because the analysis is incorrect, but because the sample size is insufficient to capture the underlying biological signal given the chosen assumptions.
In my experience, studies that navigate peer review successfully tend to treat power analysis not as a one-off calculation, but as a structured and revisitable analytical workflow. Assumptions are made explicit, alternatives can be explored, and results can be updated transparently when reviewers ask “what if?”. This perspective motivates the framework outlined in this article and sets the stage for its executable implementation.
Scope & Purpose: What this workflow covers
This article introduces the core biostatistical concepts behind power analysis and outlines a high-level analytical workflow.
While this conceptual foundation is often sufficient to understand what decisions are required, applying power analysis in real studies typically involves iterating across assumptions, adapting to specific experimental designs, and selecting appropriate software tools.
These practical considerations are beyond the scope of this introductory post, but they follow directly from the workflow described here and motivate its executable implementation.
Core concepts informing the workflow
Before diving into sample size calculation and power analysis, it is important to revisit a few fundamental biostatistical concepts. As a microbiologist turned data analyst, my goal here is to explain these ideas as simply and accurately as possible.
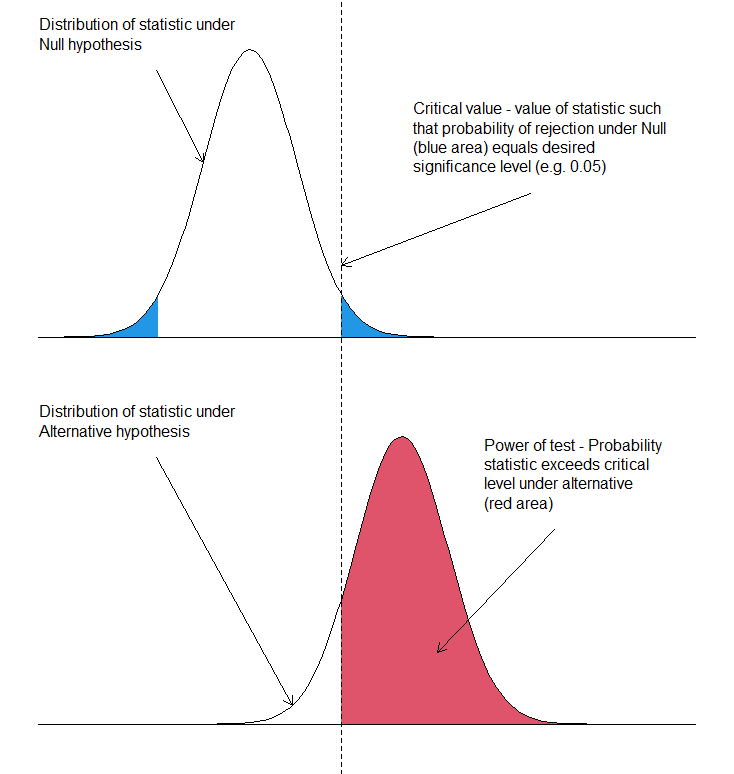
- Type I Error (α error): When comparing an experimental group to a control group, we test whether an observed difference is real or due to chance. If our test statistic exceeds a critical threshold (based on the chosen significance level, α), we reject the null hypothesis. However, there is always a probability - commonly set at 5% - that we reject the null hypothesis even when it is actually true. This false-positive conclusion is called a Type I error.
- Type II Error (β error): A Type II error occurs when we fail to reject the null hypothesis even though a true difference exists between groups. In other words, it represents a missed detection. The probability of making this error is denoted by β.
- Power (1 – β): Statistical power is the probability of correctly detecting a true difference if it exists. A study with higher power is more likely to identify meaningful effects, while a low-powered study risks overlooking them.
- Significance Level (α): The significance level is the threshold probability of observing extreme results under the null hypothesis. It defines the cut-off for deciding whether an observed difference is statistically significant.
- Effect Size: Effect size quantifies the magnitude of difference in a biological or clinical outcome—for example, changes in alpha-diversity, relative abundance of taxa, or other microbiome-related metrics. The appropriate measure of effect size depends on the type of outcome data (continuous, categorical, or count-based). Researchers often obtain plausible effect size estimates from pilot studies or prior literature. Importantly, the smaller the effect size one aims to detect, the larger the sample size and power required to ensure reliable results.
- Population variance: The population variance quantifies spread of the outcome variable, which is an essential component in calculating critical values and then power. While it is often unknown, one can infer population variance from sample variance reported in pilot studies or literature.
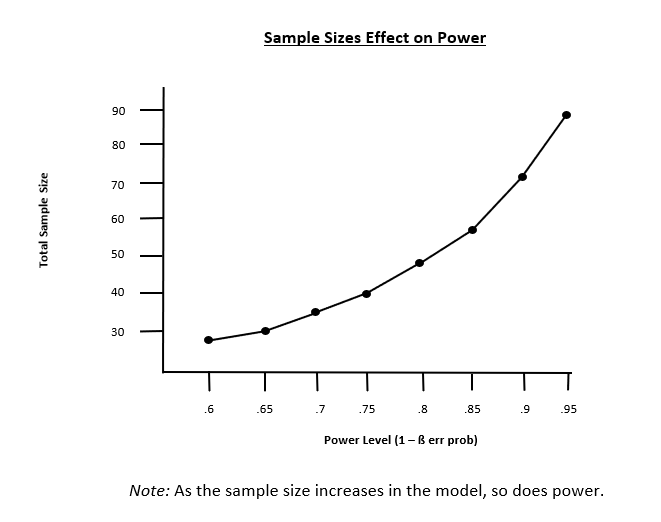
- Power curve: A graphical tool that shows how statistical power changes with sample size. The upward-sloping curve illustrates that larger sample sizes generally lead to higher statistical power.
Together, these concepts form the foundation for sample size determination and power analysis, helping researchers balance the risks of false positives, false negatives, and practical feasibility when designing experiments.
Workflow for reproducible power analysis
Step 1. Define the research question
Begin by clearly articulating the objective of your study. The following guiding questions can help refine the research question:
- What outcome do you aim to measure or detect?
- Does the analysis involve comparing outcomes between two or more groups, or modeling associations using regression?
Example: Detecting a difference in Shannon diversity between cases and controls.
Step 2. Choose the primary outcome
Identify the type of primary outcome, as this will influence both the statistical test and the power calculation approach.
Common outcome types include:
- Continuous
- Proportion
- Binary
- Multivariate distance-based measures
Step 3. Specify the statistical test
Select the statistical test that aligns with the research question and outcome types.
- The chosen test determines the statistical distribution used in the power calculation.
- Common examples include t-test, ANOVA, regression models, PERMANOVA, χ² tests, and others.
Step 4. Specify effect size
Define the minimum scientifically meaningful difference you want to detect.
Effect size can be informed by:
- Pilot data
- Previous literature
- Clinician or domain-expert input
- Biological relevance (not purely statistical considerations)
Common effect size metrics include:
- Cohen’s d (difference in means)
- R² in PERMANOVA
- Odds ratio
- hazard ratio
- Fold change in abundance
Step 5. Specify design parameters
Set the key parameters that govern hypothesis testing:
- α (significance level), typically 0.05
- Power, commonly 0.80 or 0.90
- One-sided versus two-sided tests
- Multiple testing correction, if applicable
Step 6. Perform the power or sample size calculation
Estimate the required sample size using:
- The specified effect size
- The selected statistical test
- Chosen α and power levels
- The corresponding test-specific distribution (e.g., t, Z, χ², F, noncentral F)
This can be done analytically using closed-form formulas or via simulation when assumptions are complex.
Step 7. Interpret the results
Finally, interpret the power analysis results in the context of study feasibility, scientific relevance, and potential limitations, and assess whether adjustments to the design are necessary.
Iteration pain point & Why a template helps
In practice, researchers rarely run power analysis just once. Effect sizes are uncertain, reviewers request alternative assumptions, and multiple outcomes must be evaluated. Repeating these steps manually, especially across different tests or designs, quickly becomes time-consuming and error-prone.
Summary and practical next steps (with Notebook template)
The workflow above defines what decisions are required for power analysis in microbiome studies.
In practice, these steps are rarely executed once. Researchers often:
- iterate across multiple outcomes,
- explore a range of plausible effect sizes,
- respond to reviewer requests for alternative assumptions,
- and document results in a reproducible way.
To support this process, I implemented the same workflow in a Python notebook template, where each step maps directly to code cells and visual outputs.