Exploring Ames Housing Prices: A Data-Driven Analysis
Exploratory data analysis for house price prediction, a Kaggle competition
Introductory
Welcome to our interactive project page on Ames Housing Prices. Using cutting-edge data analysis techniques, we delve into key factors driving home values. Explore the relationships between property features, neighborhood characteristics, and sale prices to uncover actionable insights for buyers, sellers, and industry professionals.
Exploratory Insights: Understanding the Data
This section offers an overview of the data we explored. The Ames dataset includes 79 variables detailing physical property features, construction quality, and more. By visualizing patterns, we aim to extract meaningful insights that support predictive modeling.
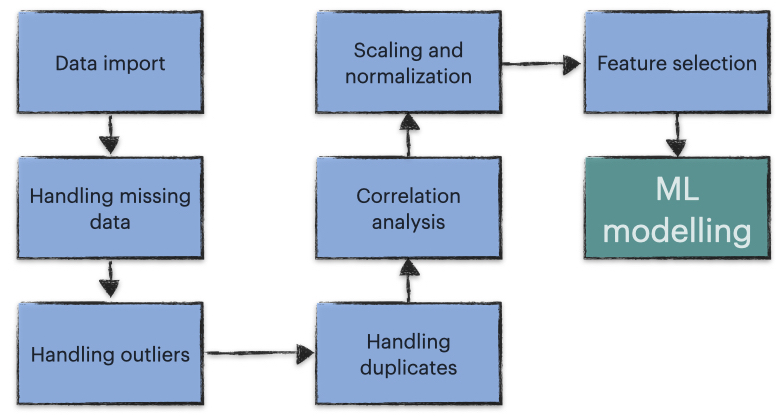
Data Cleaning and Preprocessing: Preparing the Data for Analysis
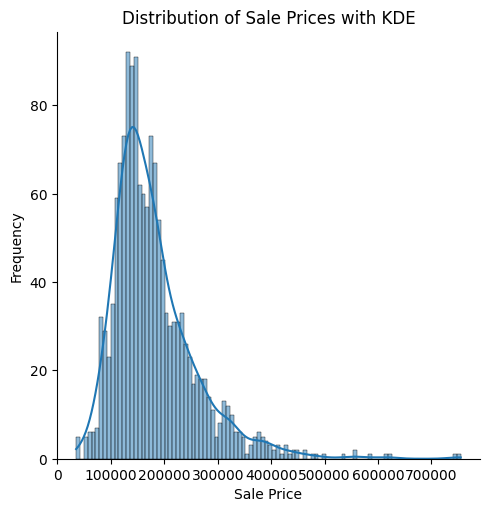
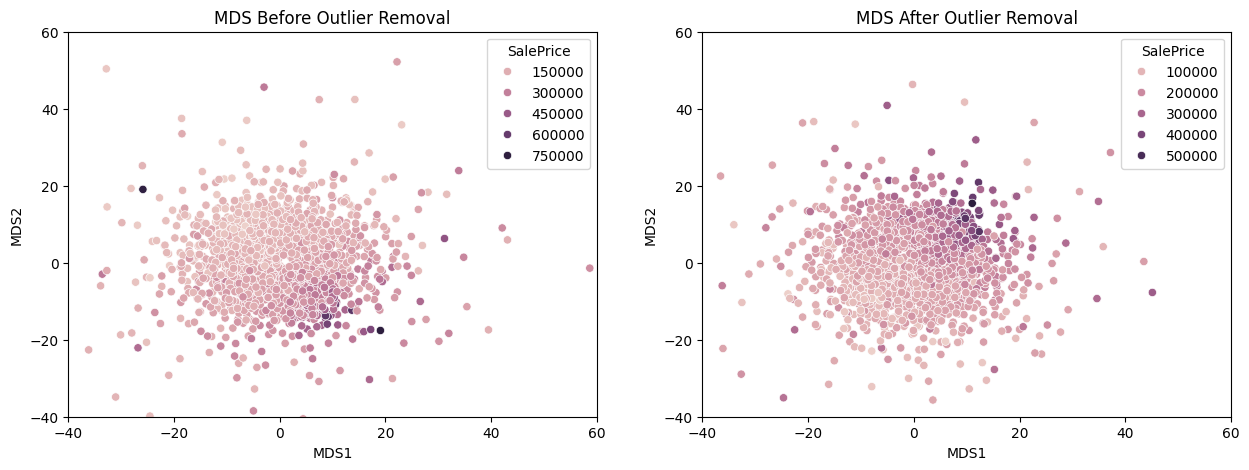
Accurate results require clean data. In this phase, we handled missing values, normalized skewed distributions, and removed significant outliers. These steps enhanced the dataset’s reliability for model training and prediction.
Key Findings: What Influences House Prices the Most?
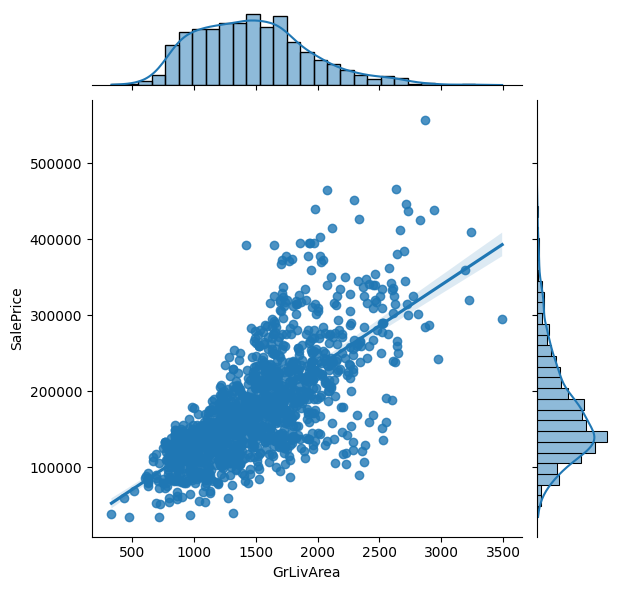
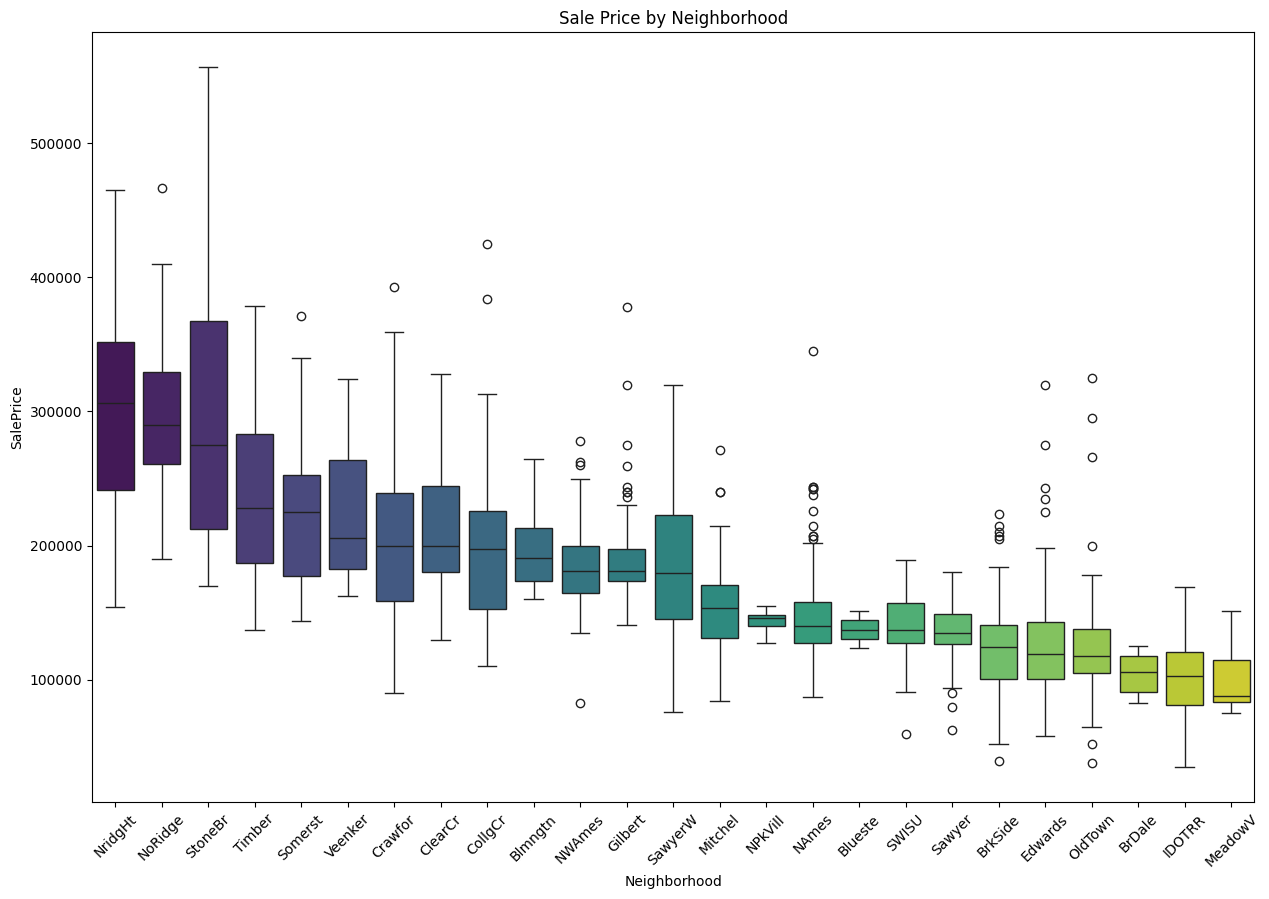
Our analysis identifies several critical factors influencing house prices in Ames. Variables like construction quality (OverallQual), above-ground living area (GrLivArea), and garage capacity (GarageCars) are top predictors, alongside categorical variables like Neighborhood and KitchenQual.”
Table 1: Top Predictors (categorical variables) by Effect Size and Correlation
| Feature | Eta_squared | Description |
|---|---|---|
| Neighborhood | 0.57 | Physical locations within Ames city limits |
| ExterQual | 0.49 | Evaluates the quality of the material on the exterior |
| BsmtQual | 0.48 | Evaluates the height of the basement |
| KitchenQual | 0.46 | Kitchen quality |
| GarageFinish | 0.33 | Interior finish of the garage |
| Foundation | 0.30 | Type of foundation |
| HeatingQC | 0.21 | Heating quality and condition |
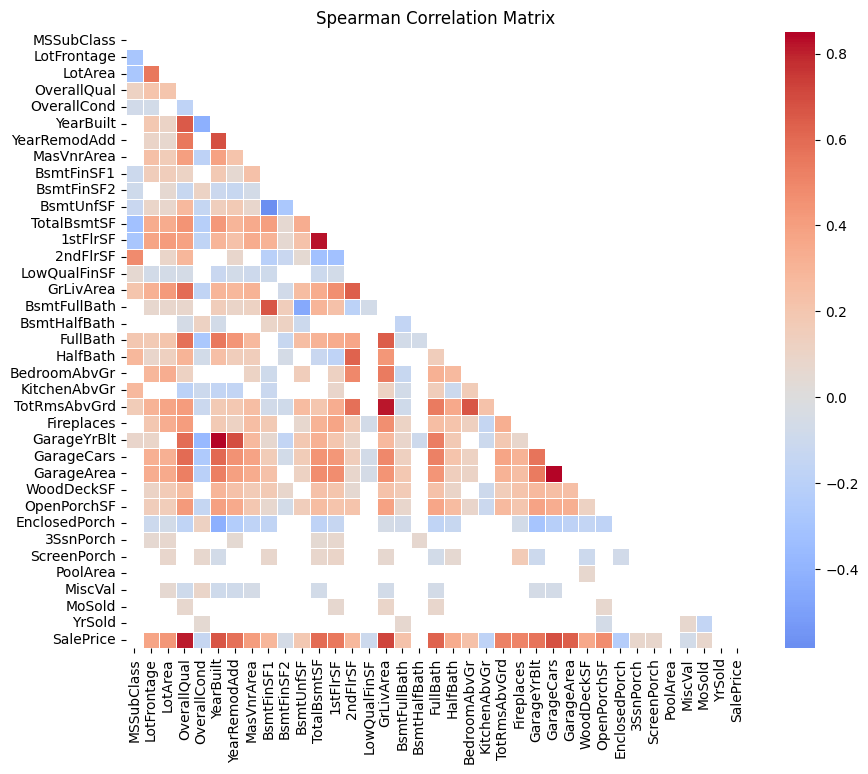
Table 2: Top Predictors (numeric variables) by Spearman Correlation Estimate
| Feature | Correlation | Description |
|---|---|---|
| OverallQual | 0.81 | Rates the overall material and finish of the house |
| GrLivArea | 0.72 | Above grade (ground) living area square feet |
| GarageCars | 0.68 | Size of garage in car capacity |
| YearBuilt | 0.67 | Original construction date |
| GarageArea | 0.64 | Size of garage in square feet |
| FullBath | 0.63 | Full bathrooms above grade |
| TotalBsmtSF | 0.59 | Total square feet of basement area |
| YearRemodAdd | 0.58 | Remodel date (same as construction date if no remodeling) |
| GarageYrBlt | 0.57 | Year garage was built |
| 1stFlrSF | 0.56 | First Floor square feet |
| TotRmsAbvGrd | 0.51 | Total rooms above grade (does not include bathrooms) |
| Fireplaces | 0.51 | Number of fireplaces |
Applications: Real-World Impacts
This project showcases how data-driven insights can guide property investments, urban development, and market strategies. By understanding what drives house prices, stakeholders can make better decisions that align with buyer preferences and market demands.
Next Steps: Where Do We Go from Here?
Building on these exploratory insights, the next phase involves predictive modeling. By leveraging identified patterns and preprocessing strategies, we aim to develop models that accurately forecast house prices.